

Preview
Creation Date
11-9-2021
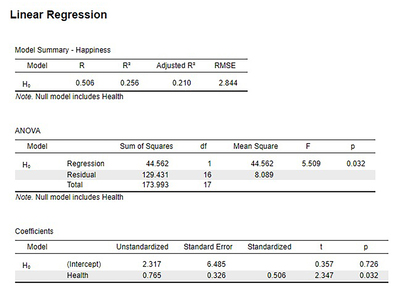
Description
FIGURE 13.4. Output from JASP for the linear regression described in the happiness and Well-Being example. The output provides the slope (b) of the line in the Coefficients table under health Unstandardized (0.765), the y-intercept (a) of the line in the Coefficients table under (intercept) Unstandardized (2.317, note slightly different from hand calculations due to rounding). The Model Summary – happiness table provides R2 (.256). The ANOVA table provides the result of the F test statistic. Based on our sample of 18 people, we can predict levels of happiness based on how healthy someone is, F(1, 16) = 5.5, p = .032. (“JASP linear regression” by Rupa G. Gordon/Judy Schmitt is licensed under CC BY-NC-SA 4.0.)
OER Category
UMSL OER Created
Creative Commons License

This work is licensed under a Creative Commons Attribution-NonCommercial-Share Alike 4.0 International License.