

Preview
Creation Date
11-9-2021
Description
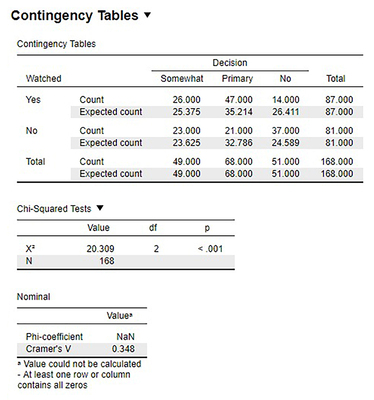
FIGURE 14.2. Output from JASP for the 2 test for independence described in the College Sports example. The output provides the 2 statistic (20.309), degrees of freedom (2), and the p value of less than .001. the output also provides the observed count and expected count in the Contingency table and Cramer’s V (.348) in the nominal table. Based on our data from 168 people, we can say that there is a statistically significant relation between whether someone watches college sports growing up and the influence a college’s sports teams have on that person’s decision on which college to attend, 2 (2, N = 168) = 20.31, p < .001, V = .348. (“JASP chi-square independence” by Rupa G. Gordon/Judy Schmitt is licensed under CC BY-NC-SA 4.0.)
OER Category
UMSL OER Created
Creative Commons License

This work is licensed under a Creative Commons Attribution-NonCommercial-Share Alike 4.0 International License.