Home
Search
Browse Collections
My Account
About
Digital Commons Network™
Skip to main content
Home
About
FAQ
My Account
Home
>
OPEN-EDUCATIONAL-RESOURCES
>
OER-IMG
OER Images
Printing is not supported at the primary Gallery Thumbnail page. Please first navigate to a specific Image before printing.
Follow
Switch View to List
View Slideshow
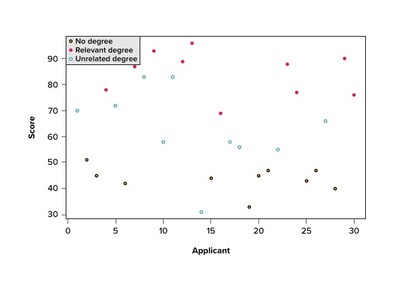
Job Test Scores by Degree
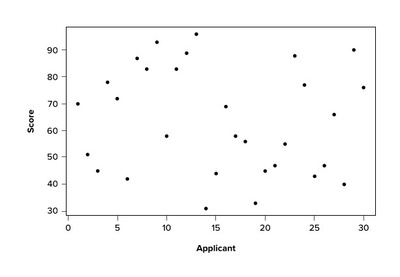
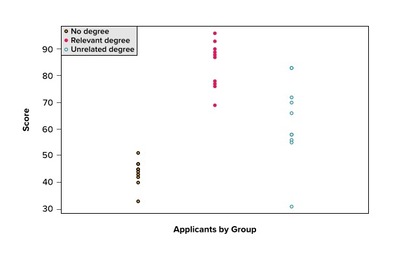
Job Test Scores by Group
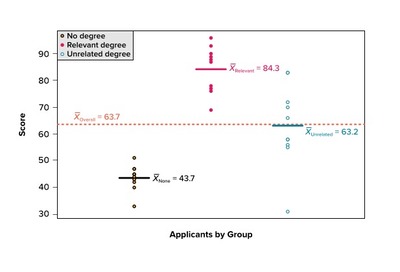
Job Test Scores Group Means
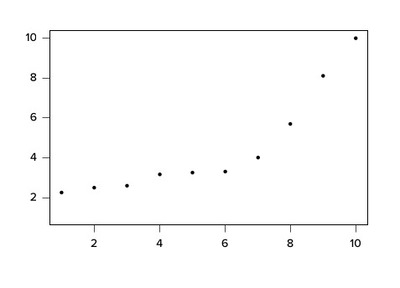
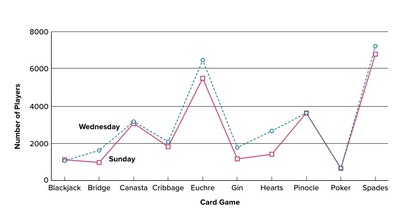
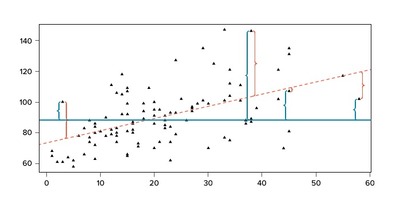
Line Chart Inappropriately Used
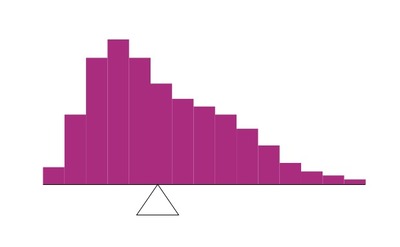
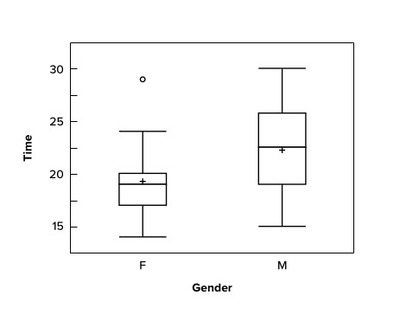
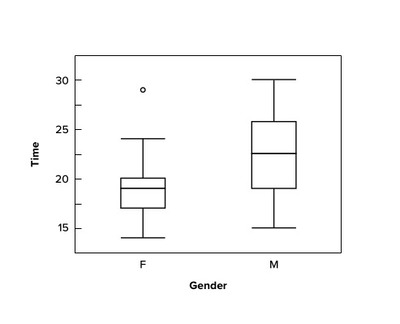
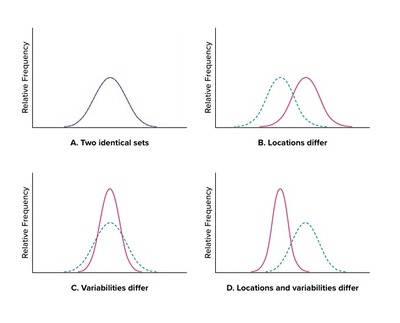
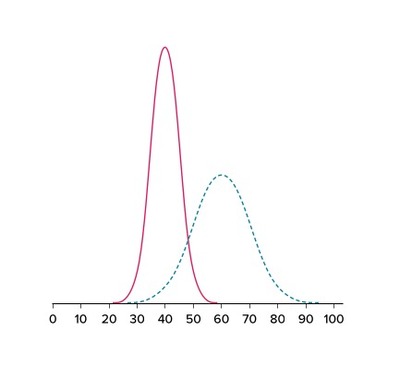
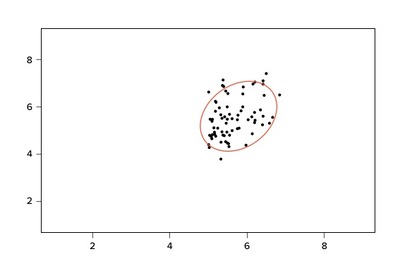
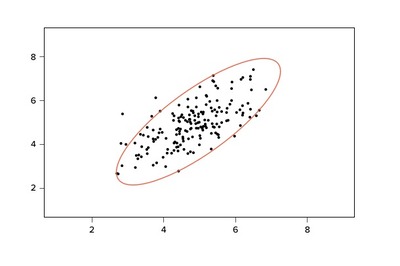
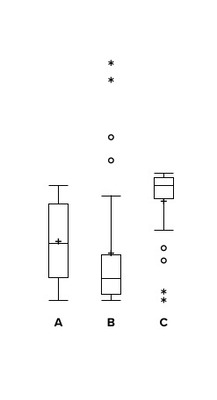
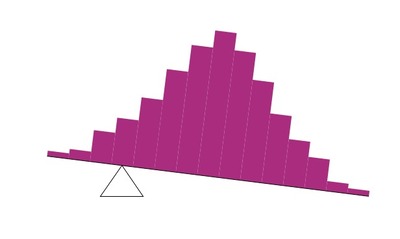
Location and Variability Differences
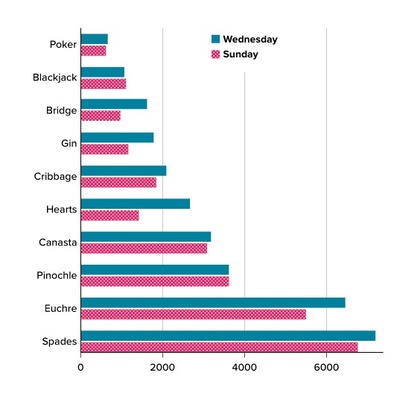
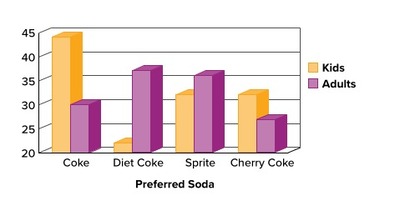
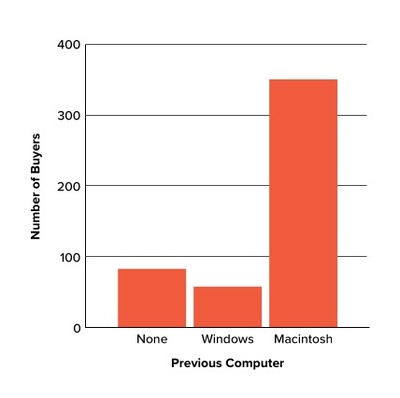
Mac Bar Chart
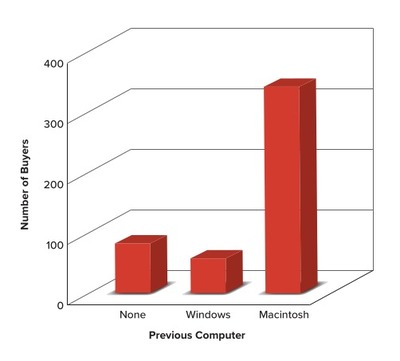
Mac Bar Chart 3D
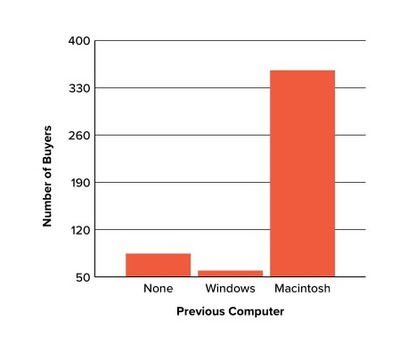
Mac Bar Chart Baseline 50
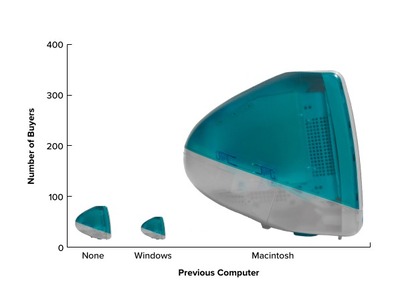
Mac Bar Chart Lie Factor
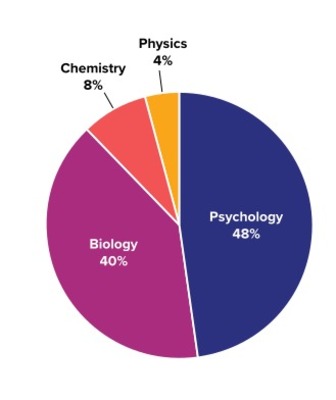
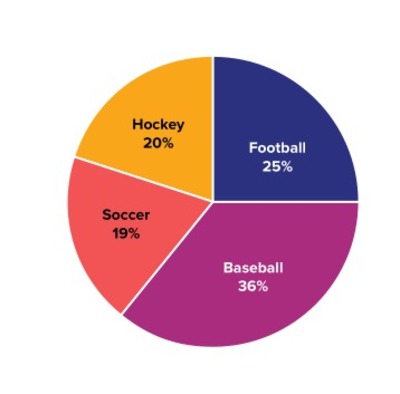
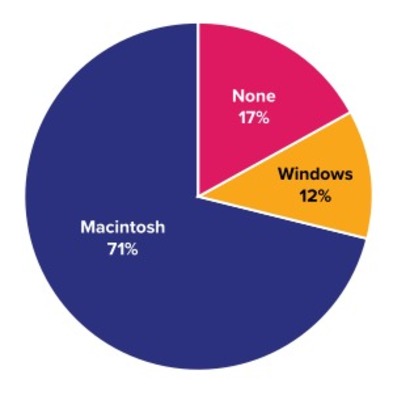
Mac Pie Chart
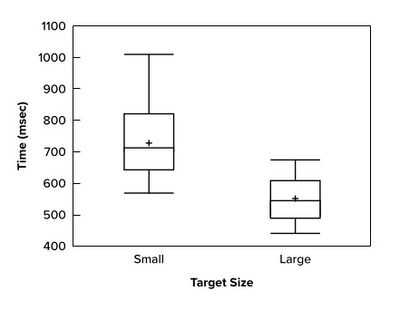
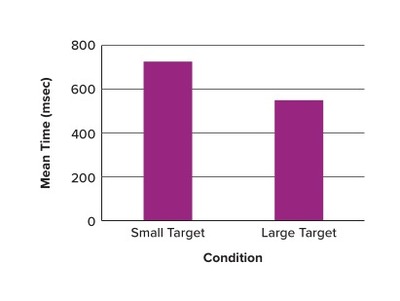
Means of Two Conditions
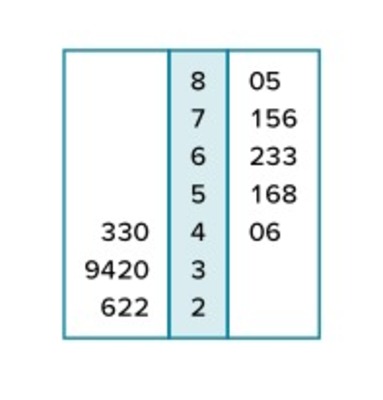
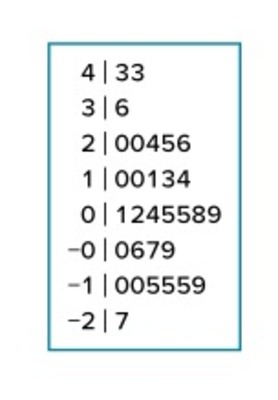
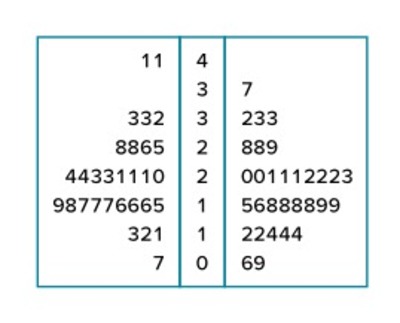
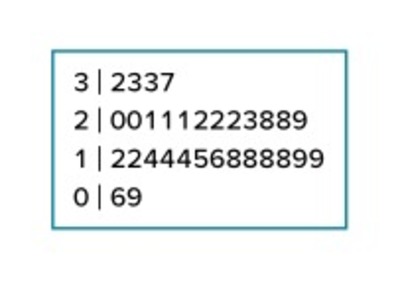
Memory Scores Back-to-Back Stem and Leaf
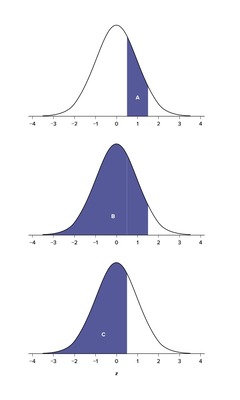
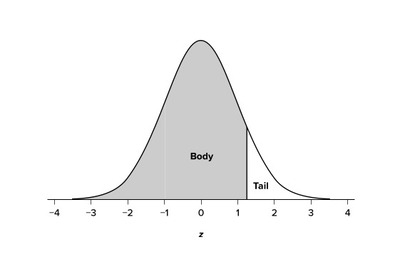
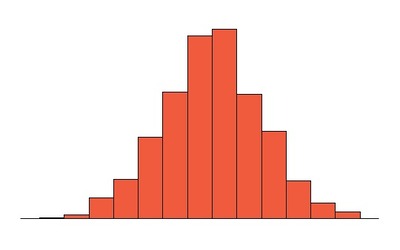
Normal Distribution Body and Tail
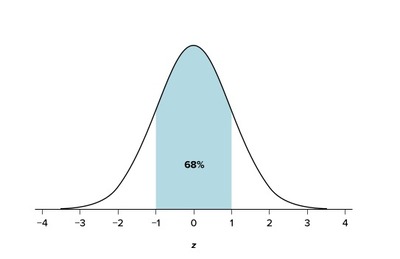
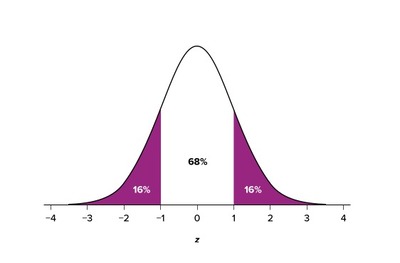
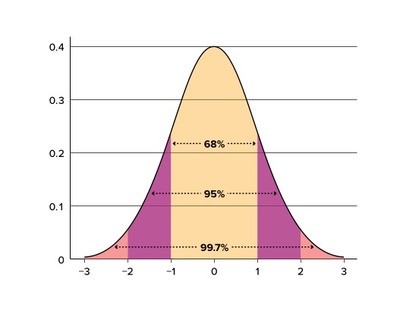
Normal Distribution Percentages
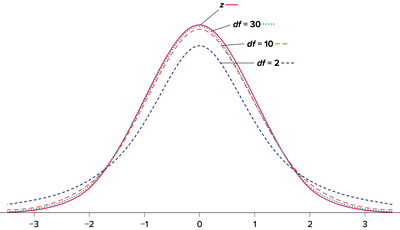
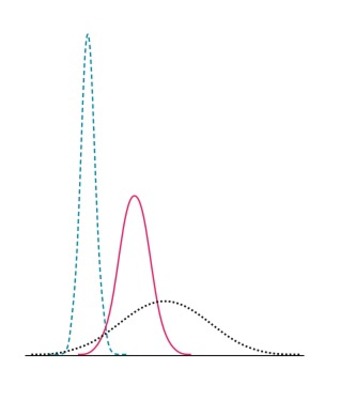
Normal Distributions with Different Means and Standard Deviations
Normal Distributions with Standard Deviations
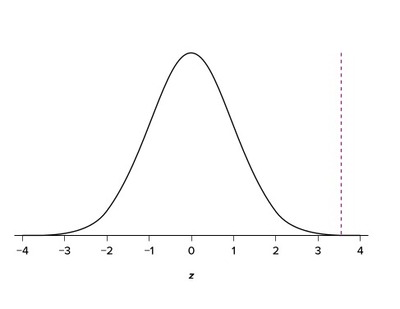
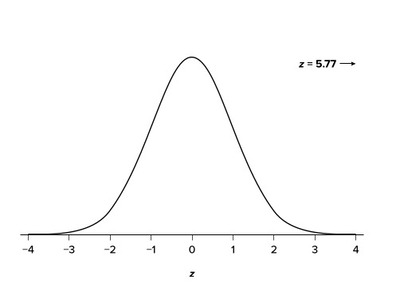
Obtained z5.77
Percent Change in CPI
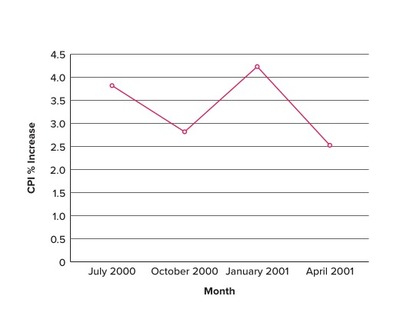
Percent Change in CPI Line Graph
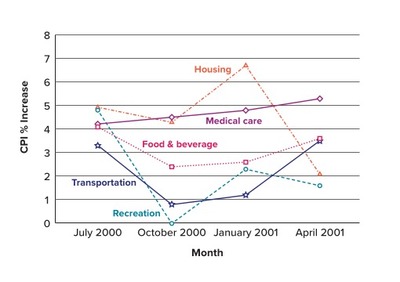
Percent Change in CPI x5 Line Graph
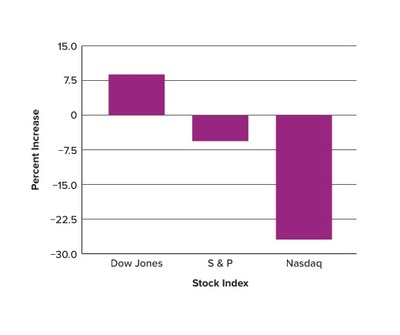
Percent Increase in Stock Indexes
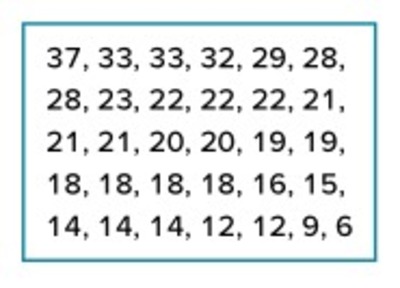
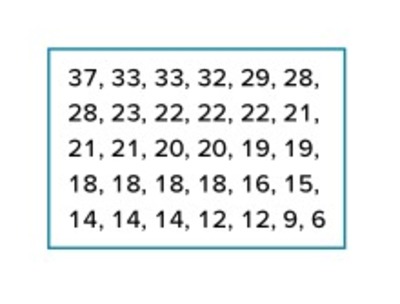
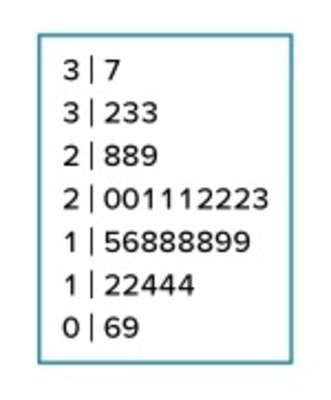
Priming Effects Raw Data
Priming Effects Stem and Leaf
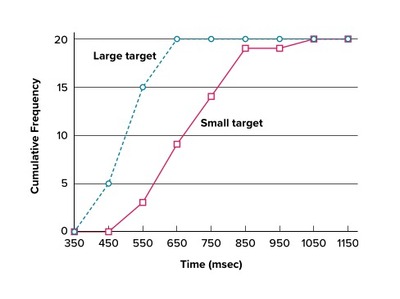
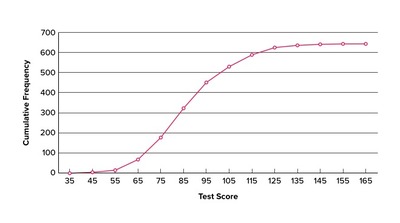
Psychology Test Scores Cumulative Frequency Polygon
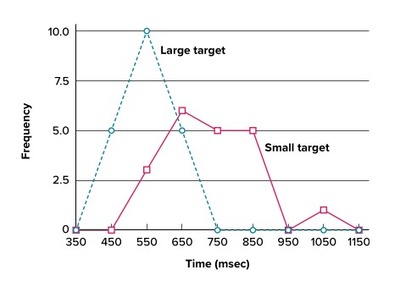
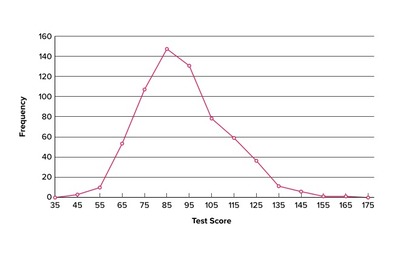
Psychology Test Scores Frequency Polygon
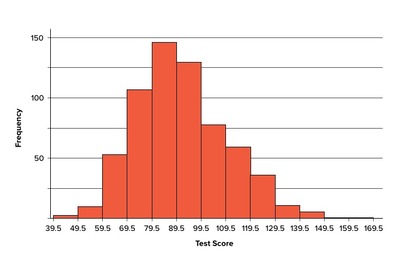
Psychology Test Scores Histogram
Psychology Test Scores Histogram
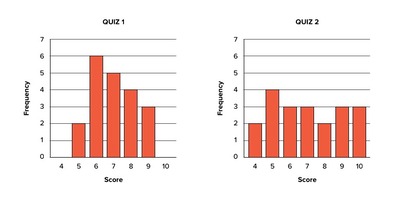
Quiz Score Bar Charts
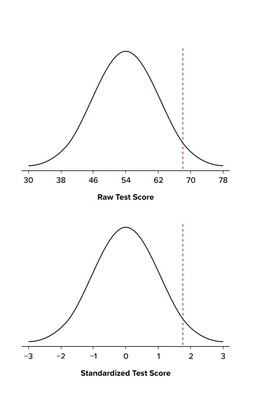
Raw and Standardized Versions of a Score
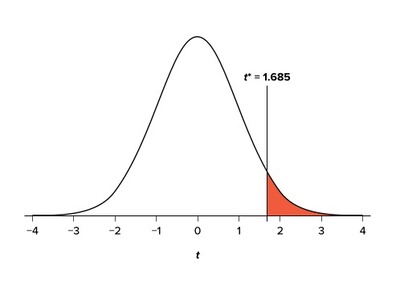
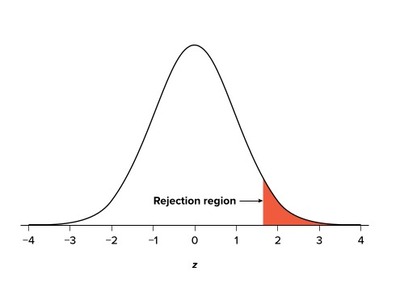
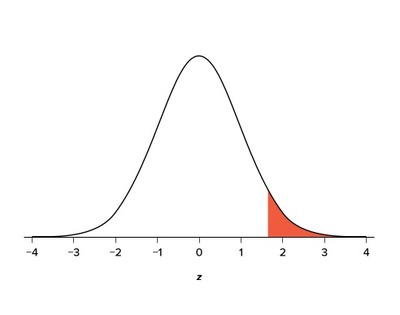
Rejection Region for One-Tailed Test
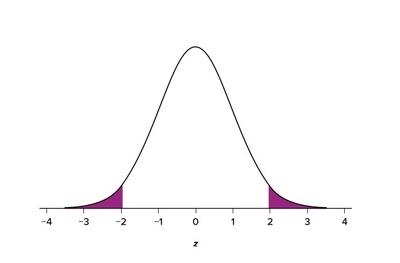
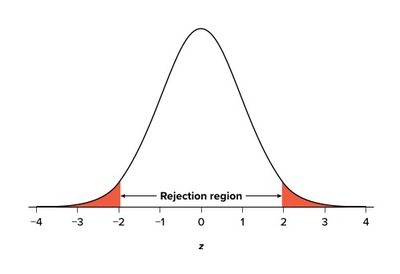
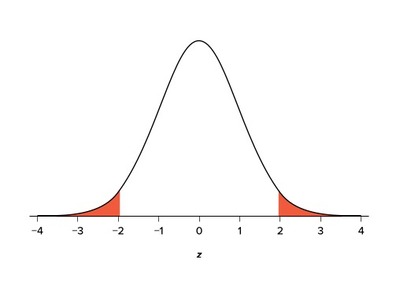
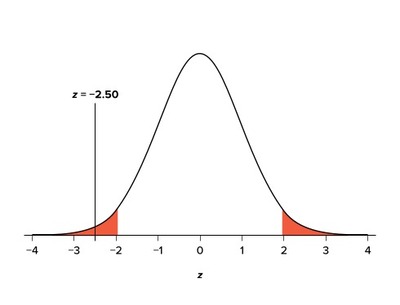
Rejection Region for Two-Tailed Test
Rejection Region t2.353
Rejection Region z1.645
Rejection Region z+-1.96
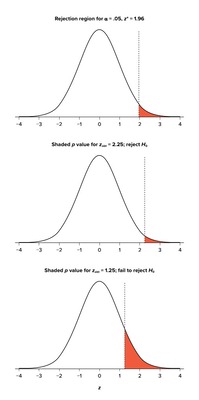
Relationship between alpha, z-obt, and p
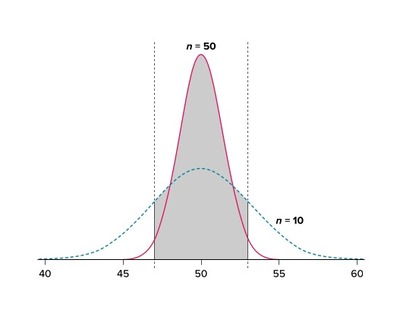
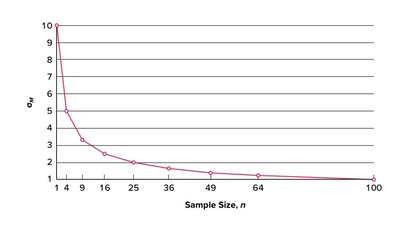
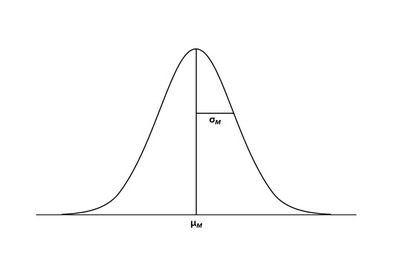
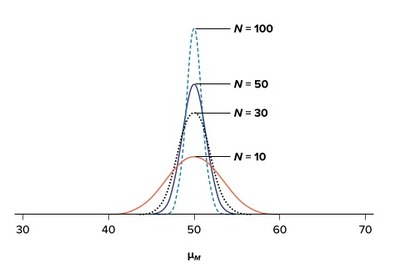
Relationship between Sample Size and Standard Error
1
2
3
Search Archived Works
Enter search terms:
Select context to search:
in this collection
in this repository
across all repositories
Advanced Search
Notify me via email or
RSS
Browse
Collections
Disciplines
Authors
Participate
FAQ
Links
University of Missouri, St. Louis
UMSL Library
Gallery Locations
View gallery on map
View gallery in Google Earth


